Third Parties

Introduction
Third-party content is a critical component of most websites today. It powers everything: analytics, live chat, advertising, video sharing and more. Third-party content provides value by taking the heavy lifting off of site owners and allows them to focus on their core competencies.
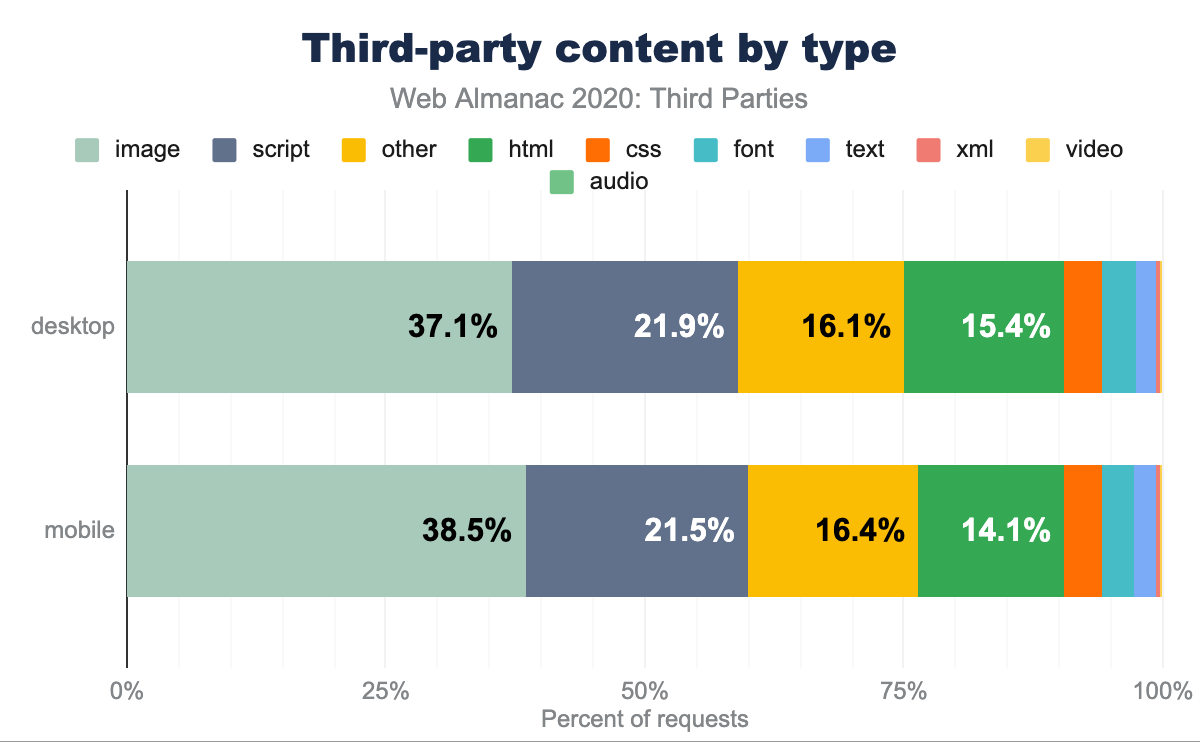
Many think of third-party content as being JavaScript-based, but the data shows that this is only true for 22% of requests. Third-party content comes in all forms, from images (37%) to audio (0.1%).
In this chapter we will review the prevalence of third-party content and how this has changed since 2019. We will also review: the impact of third-party content on page weight (a good proxy for overall performance impact), scripts that load early in the page lifecycle, the impact of third-party content on browser CPU time, and how open third-parties are with their performance data.
Definitions
Before jumping into the data we should define the terminology used in this chapter.
“Third Party”
A third-party resource is an entity outside the primary site-user relationship. It involves the aspects of the site not directly within the control of the site owner but present, with their approval. For example, the Google Analytics script is a common third-party resource.
We consider third-party resources as those:
- Hosted on a shared and public origin
- Widely used by a variety of sites
- Uninfluenced by an individual site owner
To match these goals as closely as possible, the formal definition used throughout this chapter for third-party resources is: a resource that originates from a domain whose resources can be found on at least 50 unique pages in the HTTP Archive dataset.
Note that using these definitions, third-party content served from a first-party domain is counted as a first-party content. For example: self-hosting Google Fonts or bootstrap.css is counted as first-party content.
Similarly, first-party content served from a third-party domain is counted as third-party content. An associated example: First-party images served over a CDN on a third-party domain are considered third-party content.
Provider categories
This chapter divides third-party providers into different categories. A brief description is included with each of the categories. The mapping of domain to category can be found in the third-party-web repository.
- Ad - display and measurement of advertisements
- Analytics - tracking site visitor behavior
- CDN - providers that host public shared utilities or private content of their users
- Content - providers that facilitate publishers and host syndicated content
- Customer Success - support and customer relationship management functionality
- Hosting - providers that host the arbitrary content of their users
- Marketing - sales, lead generation, and email marketing functionality
- Social - social networks and their affiliated integrations
- Tag Manager - provider whose sole role is to manage the inclusion of other third parties
- Utility - code that aids the development objectives of the site owner
- Video - providers that host the arbitrary video content of their users
- Other - uncategorized or non-conforming activity
Note on CDNs: The CDN category here includes providers that provide resources on public CDN domains (e.g. bootstrapcdn.com, cdnjs.cloudflare.com, etc.) and does not include resources that are simply served over a CDN. i.e. putting Cloudflare in front of a page would not influence its first-party designation according to our criteria.
Caveats
- All data presented here is based on a non-interactive, cold load. These values could start to look quite different after user interaction.
- The pages are tested from servers in the US with no cookies set, so third-parties requested after opt-in are not included. This will especially affect pages hosted and predominantly served to countries in scope for the General Data Protection Regulation, or other similar legislation.
- Only the home pages are tested. Other pages may having difference third-party requirements.
- Roughly 84% of all third-party domains by request volume have been identified and categorized. The remaining 16% fall into the “Other” category.
Learn more about our methodology.
Prevalence
A good starting point for this analysis is to confirm the statement that third-party content is a critical component of most websites today. How many websites use third-party content, and how many third-parties do they use?
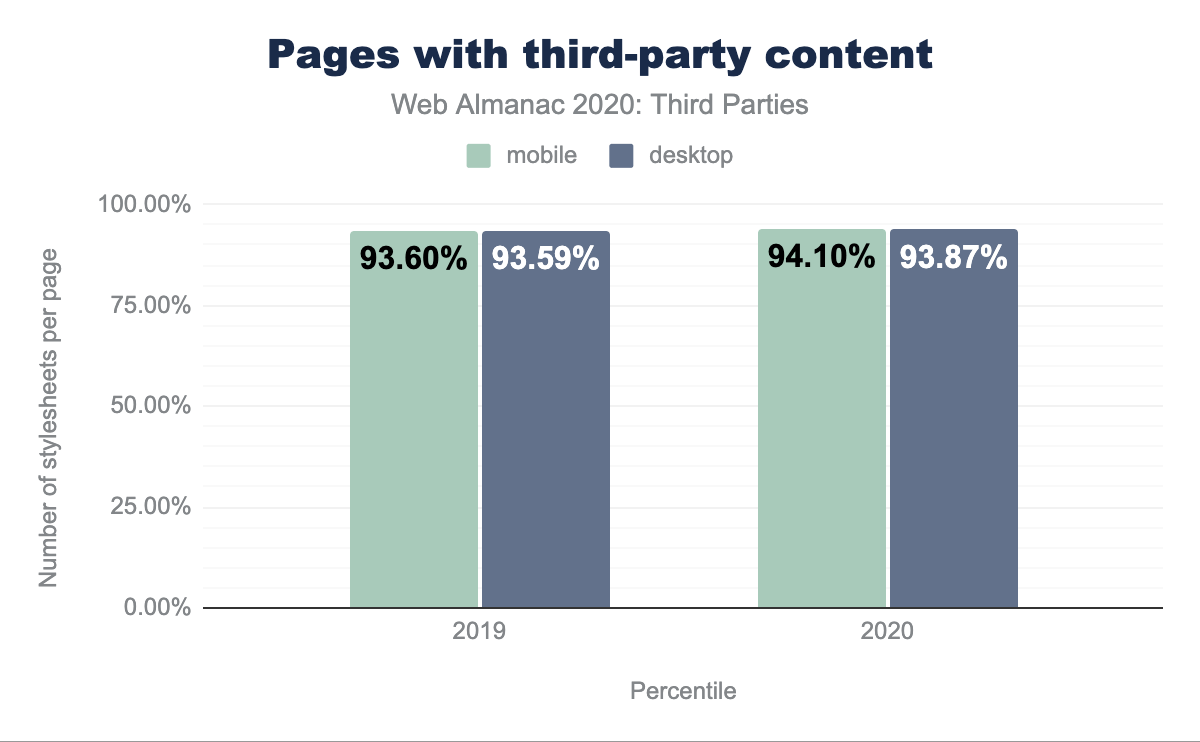
These prevalence numbers show a slight increase on the 2019 results: 93.87% of pages in the desktop crawl had at least one third-party request, the number was slightly higher at 94.10% of pages in the mobile crawl. A brief look into the small number of pages with no third-party content revealed that many were adult sites, some were government domains and some were basic landing / holding pages with little content. It is fair to say that the vast majority of pages have at least one third-party.
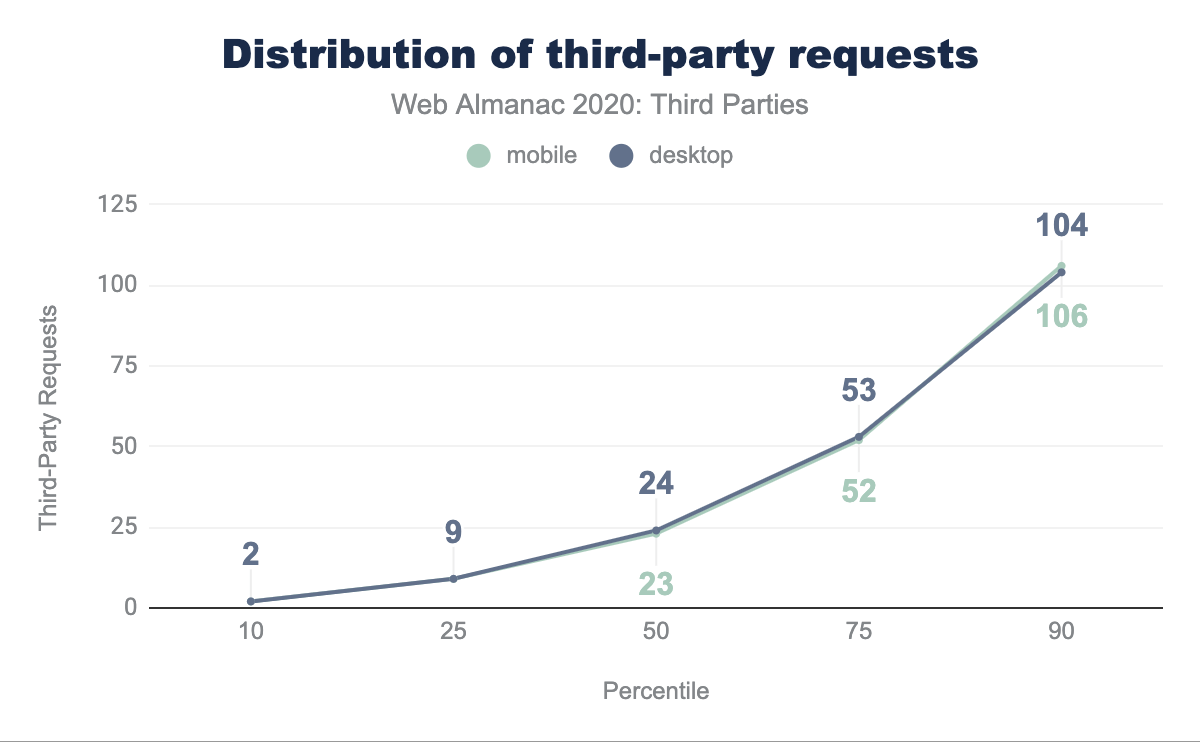
The chart below shows the distribution of pages by third-party count. The 10th percentile page has two third-party requests while the median page has 24. Over 10% of pages have more than 100 third-party requests.
Content-types
We can break down third-party requests by their content type. This is the reported content-type of the resources delivered from third-party domains.
The results show that the major contributors of third-party content are images (38%) and JavaScript (22%), with the next largest contributor being unknown (16%). Unknown is a subset of non-categorized groups such as text/plain as well as responses without a content-type header.
This shows a shift when compared to 2019: relative image content has increased from 33% to 38%, whilst JavaScript content has decreased significantly from 32% to 22%. This reduction is likely due to increased adherence to cookie and data protection regulations, reducing third-party execution until after explicit user opt-in which is out of scope for HTTP Archive test runs.
Third-party domains
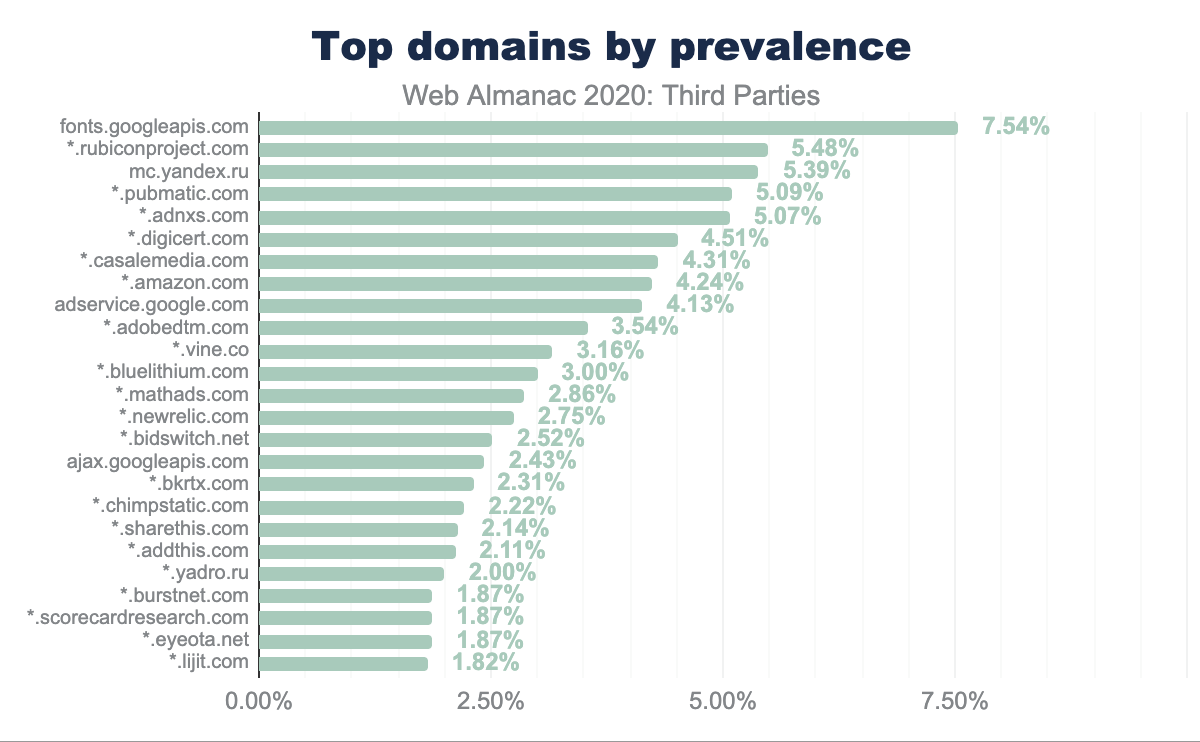
When we dig further into domains serving third-party content we see that Google Fonts is by far the most common. It is present on more than 7.5% of mobile pages tested. While fonts only account for around 3% of third-party content, almost all of these are delivered by the Google Fonts service. If your page uses Google Fonts, make sure to follow best practices to ensure the best possible user experience.
The next four most common domains are all advertising providers. They may not be requested directly by the page but through a complex chain of redirects initiated by another advertising network.
The sixth most common domain is digicert.com. Calls to digicert.com are generally OCSP revocation checks due to TLS certificates not having OCSP stapling enabled, or the use of Extended Validation (EV) certificates which prevent pinning of intermediate certificates. This number is exaggerated in HTTP Archive due to all page loads being effectively first-time visitors - OCSP responses are generally cached and valid for seven days in real-world browsing. See this blog post to read more on this issue.
Further down the list at 2.43% is ajax.googleapis.com, Google’s Hosted Libraries project. Whilst loading a library such as jQuery from a hosted service is easy, the additional cost of a connection to a third-party domain may have a negative impact on performance. It is best to host all critical JavaScript and CSS on the root domain, if possible. There is also now no cache benefit to using a shared CDN resource, as all major browsers partition caches by page. Harry Roberts has written a detailed blog post on how to host your own static assets.
Page weight impact
Third-parties can have a significant impact on the weight of a page, measured as the number of bytes downloaded by the browser. The Page Weight chapter explores this in more detail, here we focus on the third-parties that have the greatest impact on page weight.
Heaviest third-parties
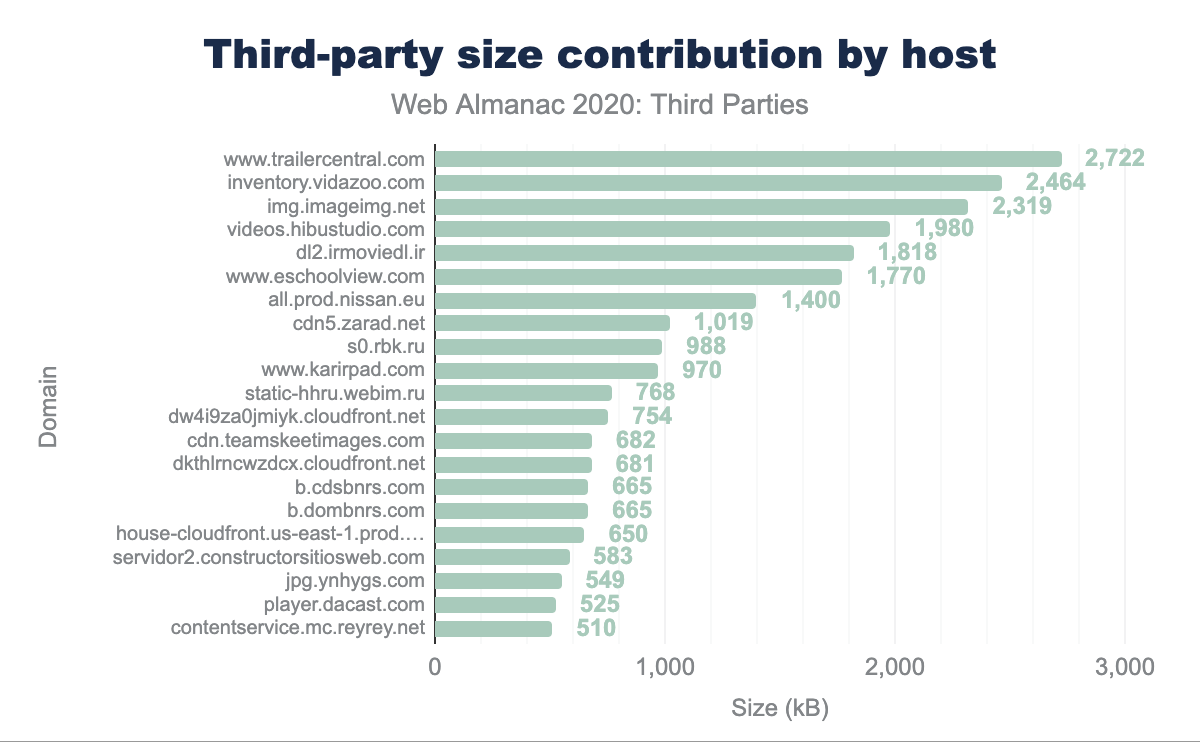
We can extract the largest third-parties by the median page weight impact, i.e. how many bytes they bring to the pages they are on. The results are interesting as this does not take into account how popular the third-parties are, just their impact in bytes.
The top contributors of page weight are generally media content providers, such as image and video hosting. Vidazoo, for example, results in a median page weight impact of about 2.5MB. The inventory.vidazoo.com domain provides video hosting, so a median page with this third-party has an extra 2.5MB of media content!
A simple method to reduce this impact is to defer video loading until a user interacts with the page, so that the impact is reduced for those visitors that never consume the video.
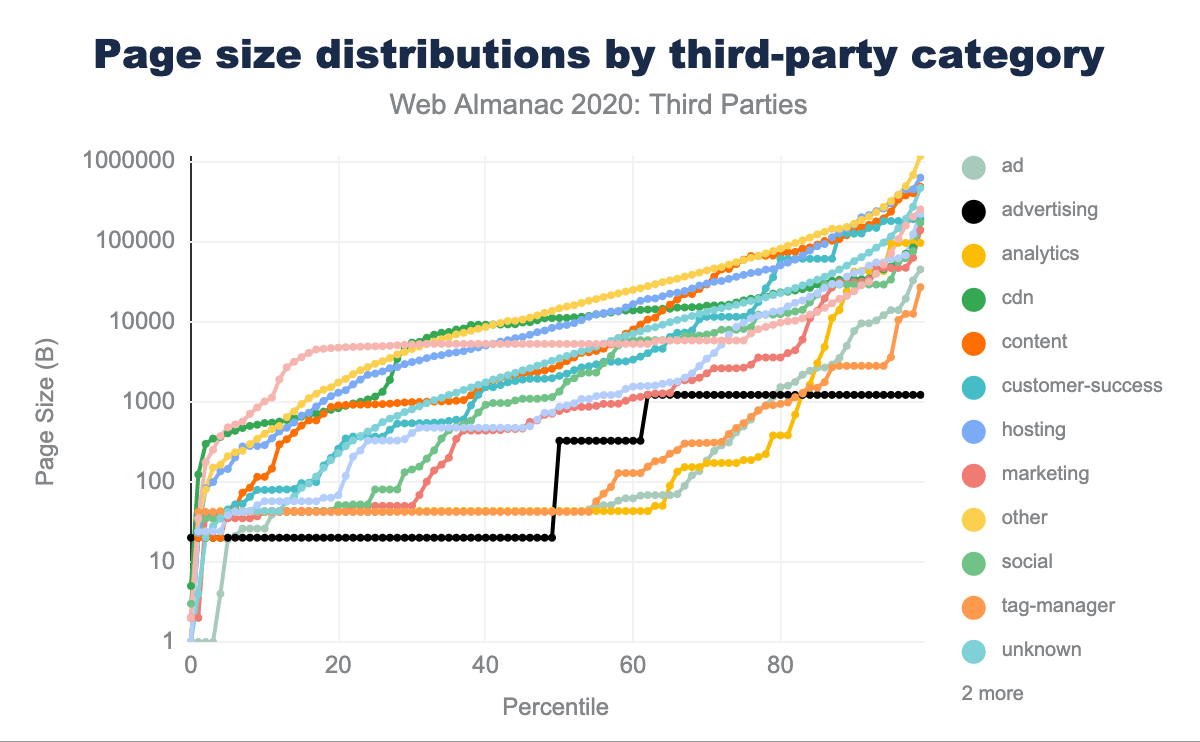
We can take this analysis further to produce a distribution of total page size (in bytes downloaded for all resources) by third-party category presence. This chart shows that the presence of most third-party categories does not have a noticeable impact on total page size: this would be visible as a divergence in the plots. A notable exception to this is Advertising (in black) which shows a very small relationship with page size, indicating that advertisement requests do not add significant weight to pages. This is likely because many of these requests are small redirects, the median is only 420 bytes. We see similar low impact for tag managers, and analytics.
On the other end of the spectrum, the categories CDN, Content and Hosting all represent strong relationship with total page weight. This indicates that sites using hosted services are generally larger in page weight.
Cacheability
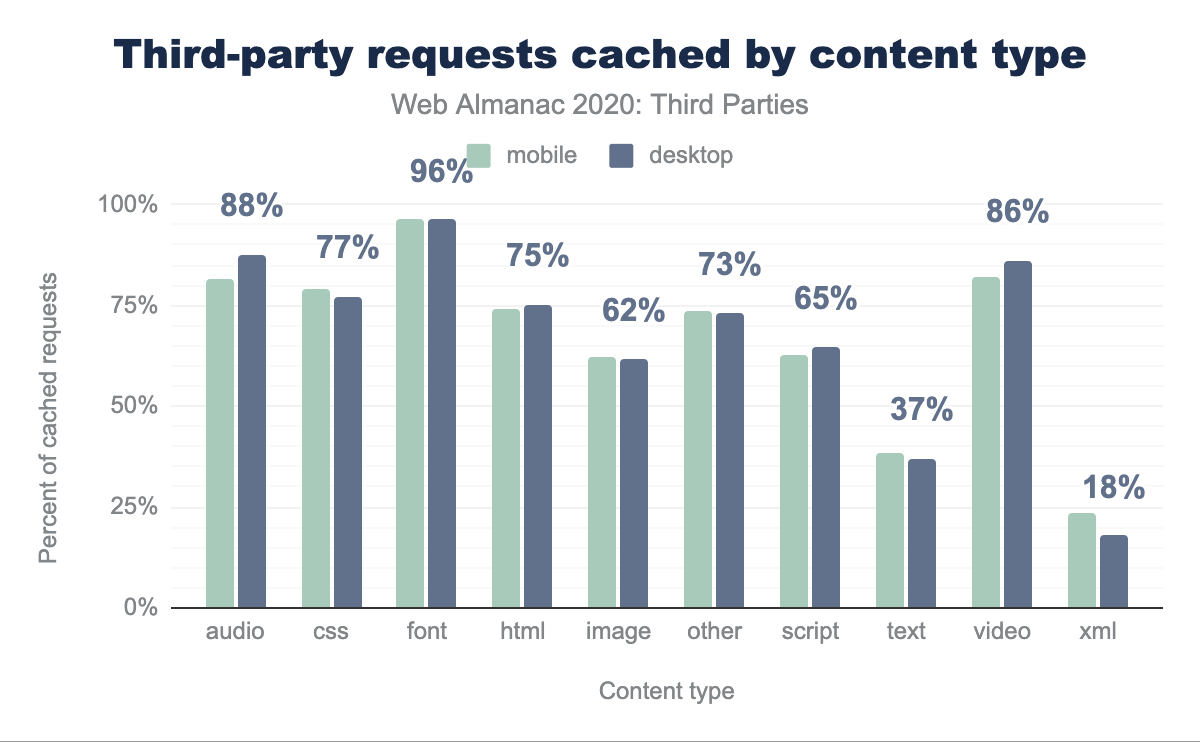
Some third-party responses should always be cached. Media such as images and videos served by a third-party, or JavaScript libraries are good candidates. On the other hand, tracking pixels and analytics beacons should never be cached. The results show that overall two-thirds of third-party requests are served with a valid caching header such as Cache-Control.
Breaking down by response type confirms our assumptions: xml and text responses (as commonly delivered by tracking pixels / analytics beacons) are less likely to be cacheable. Surprisingly, less than two-thirds of images served by third-parties are cacheable. On further inspection, this is due to the use of tracking ’pixels’ which are returned as non-cacheable zero-size gif image responses.
Large redirects
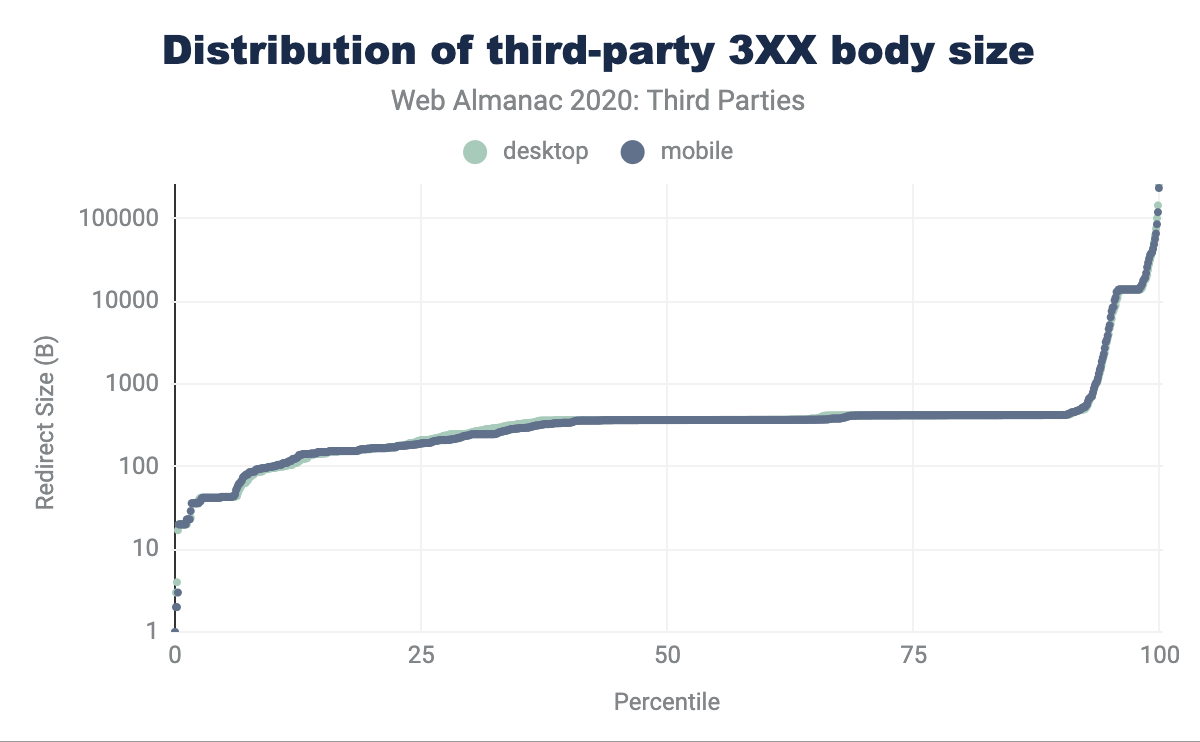
Many third-parties result in redirect responses, i.e. HTTP status codes 3XX. These occur due to the use of vanity domains or to share information across domains through request headers. This is especially true for advertising networks. Large redirect responses are an indication of a misconfiguration, as the response should be around 340B for a valid Location response header plus overheads. The chart below shows the distribution of body size for all third-party redirects in the HTTP Archive.
The results show that the majority of 3XX responses are small: the 90th percentile is 420 bytes, i.e. 90% of 3XX responses are 420 bytes or smaller. The 95th percentile is 6.5 kB, the 99th is 36 kB and the 99.9th is over 100 kB! Whilst redirects may seem innocuous, 100kB is an unreasonable amount of bytes over the wire for a response that simply leads to another response.
Early-loaders
Scripts that load late in the page will have an impact on total page load duration and page weight but might have no impact on the user experience. Scripts that load early in the page, however, will potentially cannibalize bandwidth for critical first-party resources and are more likely to interfere with the page load. This can have a detrimental impact on performance metrics and user experience.
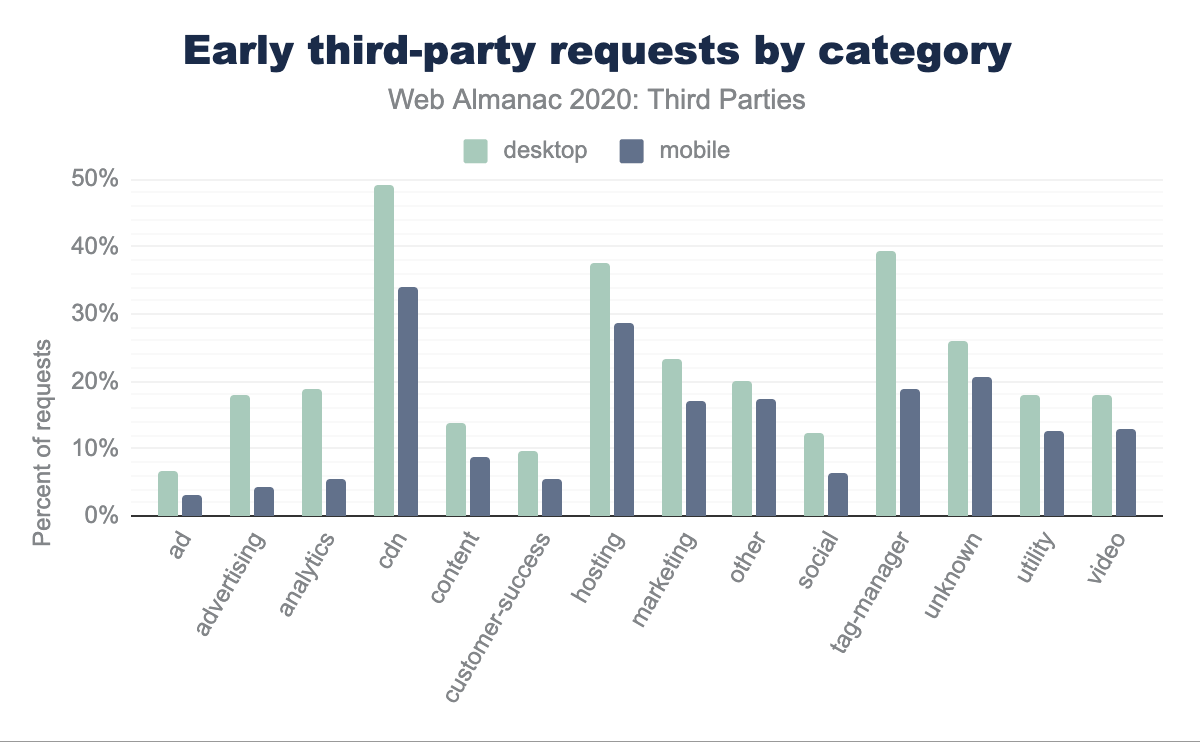
The chart below shows the percentage of requests that load early, by device type and third-party category. The three stand-out categories are CDN, Hosting and Tag Managers: all of which tend to deliver JavaScript that is requested in the head of a document. Advertising resources are least likely to load early in the page, due to advertisement network requests generally being asynchronous scripts run after page load.
CPU impact
Not all bytes on the web are equal: a 500 KB image may be far easier for a browser to process than a 500 KB compressed JavaScript bundle, which inflates to 1.8MB of client-side code! The impact of third-party scripts on CPU time can be far more critical than the additional bytes or time spent on the network.
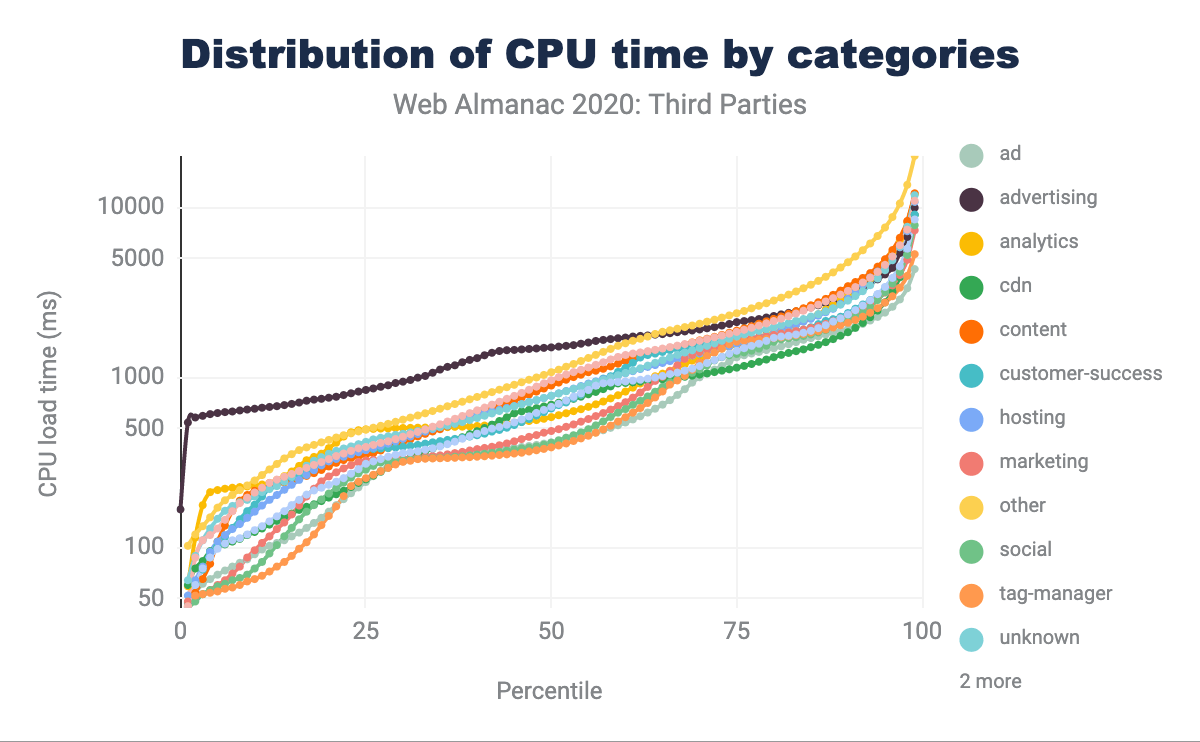
We can correlate the presence of third-party categories with the total CPU time on the page, this allows us to estimate the impact of each third-party category on CPU time.
This chart shows the probability density function of total page CPU time by the third-party categories present on each page. The median page is at 50 on the percentile axis. The data shows that all third-party categories follow a similar pattern, with the median page between 400 - 1,000 ms CPU time. The outlier here is advertising (in black): if a page has advertising tags it is much more likely to have high CPU usage during page load. The median page with advertising tags has a CPU load time of 1,500 ms, compared to 500 ms for pages without advertising. The high CPU load time at the lower percentiles indicates that even the fastest sites are impacted significantly by the presence of third-parties categorized as advertising.
timing-allow-origin prevalence
The Resource Timing API allows website owners to measure the performance of individual resources via JavaScript. This data is, by default, extremely limited for cross-origin resources like third-party content. There are legitimate reasons for not providing this timing information such as responses that vary by authentication state: e.g. a website owner may be able to determine if a visitor is logged into a Facebook by measuring the response size of a widget request. For most third-party content, though, setting the timing-allow-origin header is an act of transparency to allow the hosting website to track performance and size of their third-party content.
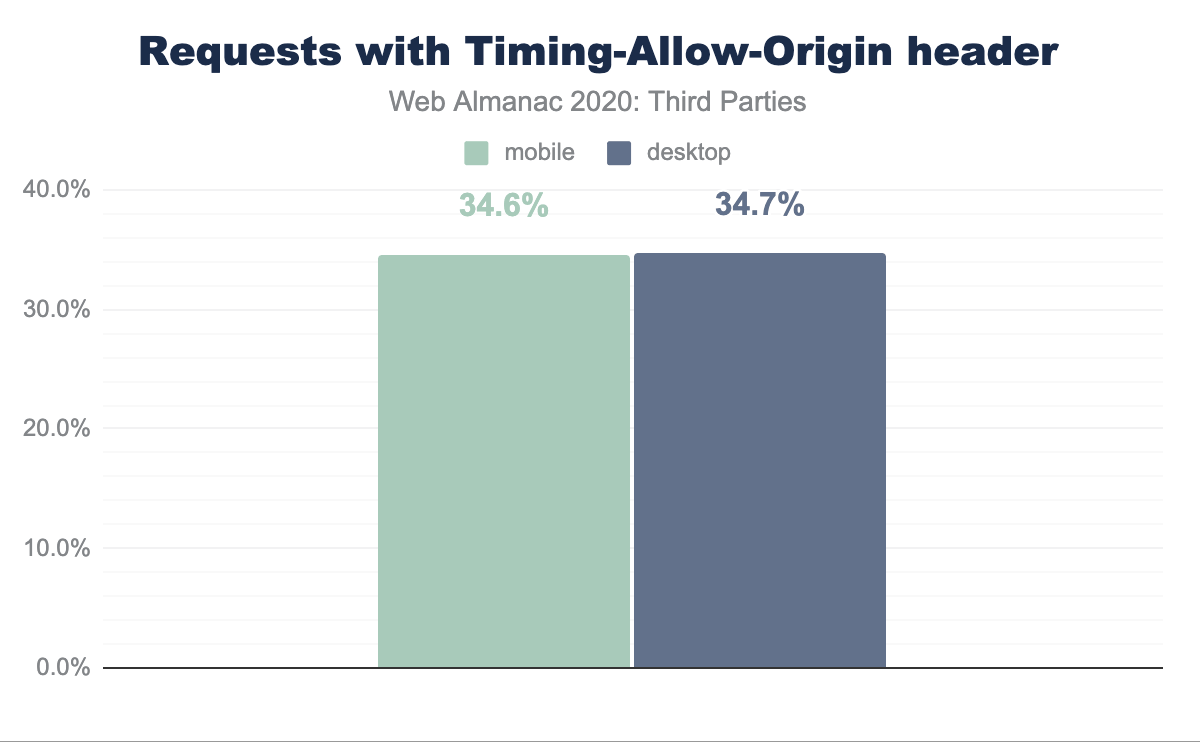
timing-allow-origin header.
The results in HTTP Archive show that only one third of third-party responses expose detailed size and timing information to the hosting website.
Repercussions
We know that adding arbitrary JavaScript to our sites introduces risks to both site speed and security. Site owners must be diligent to balance the value of the third-party scripts they include with the speed penalty they may bring, and use modern features such as subresource integrity and content security policy to maintain a strong security posture. See the Security chapter for more detail on these and other browser security features.
Conclusion
One of the surprises in the data from 2020 is the drop in relative JavaScript requests: from 32% of the total to just 22%. It is unlikely that the actual amount of JavaScript on the web has decreased this significantly, it is more likely that websites are implementing consent management - so that most dynamic third-party content is only loaded on user opt-in. This opt-in process could be managed by a Consent Management Platform (CMP) in some cases. The third-party database does not yet have a category for CMPs, but this would be a good analysis for the 2021 Web Almanac and is covered through a different methodology in the Privacy chapter.
Advertising requests appear to have an increased impact on CPU time. The median page with advertising scripts consume three times as much CPU as those without. Interestingly though, advertising scripts are not correlated with increased page weight. This makes it even more important to evaluate the total impact of third-party scripts on the browser, not just request count and size.
While third-party content is critical to many websites, auditing the impact of each provider is critical to ensure that they do not significantly impact user experience, page weight or CPU utilization. There are often self-hosting options for the top contributors to third-party weight, this is especially worth considering as there is now no caching benefit to using shared assets:
- Google Fonts allows self-hosting the assets
- JavaScript CDNs can be replaced with self-hosted assets
- Experimentation scripts can be self-hosted, e.g. Optimizely
In this chapter we have discussed the benefits and costs of third-party content on the web. We have seen that third-parties are integral to almost all websites, and that the impact varies by third-party provider. Before adding a new third-party to your pages, consider the impact that they will have!
